A simple test protocol for USB/Firewire soundcards
I’m in the process of testing a number of audio interfaces aka “sound cards.” Partly this is because I’m reviewing a couple of units for the purpose of making room and loudspeaker measurements. But I also have another goal in mind, which is to use one of them as the basis of a “cheap and cheerful” measurement rig for electronic components, which is a much more demanding task. Sadly, I don’t have a spare $20k laying about for a proper test rig.
So, I decided to put together a measurement protocol for these devices. The idea is that I can characterize any such device in a way that:
- Is repeatable
- Doesn’t require access to any additional expensive equipment
- Is not overly time consuming
Here’s what I’ve come up with, with some explanation and reasoning provided where appropriate. I’d appreciate any comments or suggestions. There are seven steps/tests. The measurement programs that I am using are FuzzMeasure Pro and the Electroacoustics Toolbox. These are Mac programs but there are Windows equivalents.
1. Level calibration
First, set the digital signal generator to output a 1 kHz sine wave at full scale. (Depending on the program, it may be 0 dB or 100%.) With a multimeter, set the output gain control so that the voltage measured at the soundcard output reads 1.0 VRMS. Since most of these units have balanced inputs and outputs, the voltage is measured across the balanced line, not from one output to ground.
Connect a loopback cable from the output to the appropriate input. Usually this will be the “line” input although sometimes it can be the “mic” input – it does depend on the specifics of the interface, but this is the input that you would use if making line-level measurements. Set the input gain control so that the signal is just below full-scale, typically 0.99 of full scale, or -0.1 dB.
Notes:
- Some ADCs can’t be driven to full scale output i.e. they will clip at say 98% of full scale. In that case, set the signal generator to e.g 90% and the ADC level also to 90% of full scale. In this case, make a note of this fact – it’s most academic but should still be noted.
- Some interfaces have digitally controlled gain, and can’t be set to exactly 1.0 V for full scale. In that, just adjust the gain controls to get is as close as it can be, and make a note of it. It’s not critical for the purposes of this “simple” test protocol.
- If using a mic input, be sure to turn phantom power off. For one thing, it’s probably not a good idead to connect line-level outputs to inputs with 48V on them. I’ve done it a number of times and not damaged anything so far, but still… Also, I’ve discovered that the phantom power supply can add noise to the signal on some interfaces. This is only noticeable at low signal levels, but turning it off now may save some of your remaining hair!
The purpose of this step is to ensure that following steps are easy to deal with. Basically, by making 0 dBV equal to 0 dB FS for both input and output, everything becomes easier to explain.
In tests 4-6 below, tests are run at 0 dB, -1 dB and -20 dB. As noted, not all ADCs can be driven to 0 dB FS, hence the -1 dB test. This is also consistent with the AES17 standard for measuring digital equipment. To keep things simple, I don’t usually present the 0 dBV result.
The reason for running at -20 dB is that sometimes distortion levels drop markedly at lower signal levels. Remember that these gadgets are typically running from a single 5 V supply. And a -20 dBV level (i.e. 100 mV) is probably more representative of typical usage anyway.
2. Frequency response
With a program that easily measures and plots frequency response – like FuzzMeasure Pro – set the output level to -10 dB and run a frequency sweep at each available sample rate.
If you are using a device that has both “mic” and “line” inputs, this should be done with both sets of inputs if possible. The reason is that in some cases the “mic” input may have a low impedance that will affect low-frequency response in a way that doesn’t reflect realistic usage.
3. Residual noise
Despite the name, this is not a noise test in the sense of “random” noise. What this is really for is looking for spurious frequency components in the output signal that can confuse the distortion spectra obtained in steps 4-6.
For each available sample rate, set the FFT length to 5 seconds and select a Hamming window (if given a choice). If averaging is available, average three FFT windows – this will make the noise floor easier to see and help to make low-level non-random noise components visible. Arguably it makes the noise floor not representative of reality, but we’re not looking at absolute noise floor here.
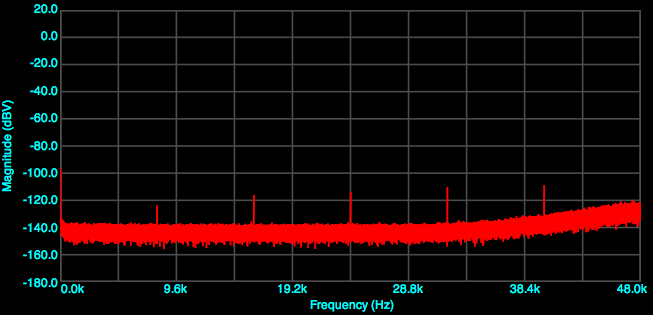
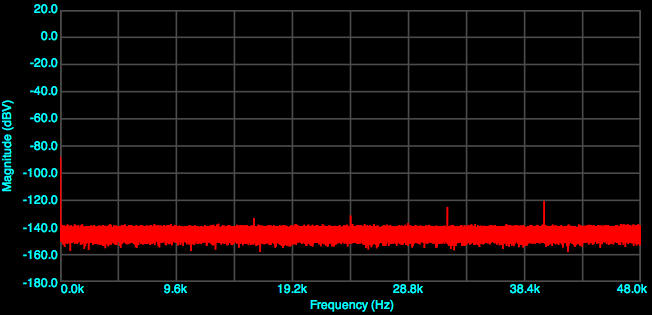
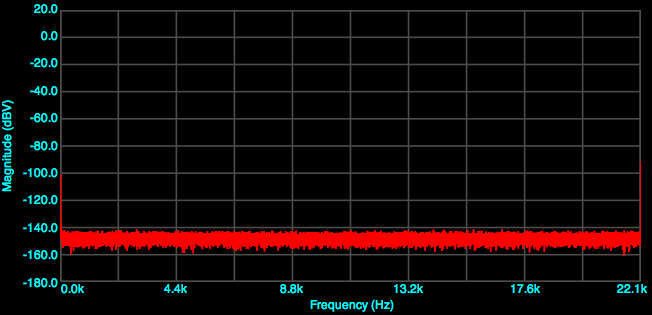
This can be an interesting test, because some sample rates are “quieter” than others. It seems that these cheap devices have a tendency to leak sub-multiples of the sample rate clock into the audio path. Often, 44.1 and 88.2 kHz are a better choice for running loopback tests than 48 and 96 kHz, either because the noise is strangely lower, or because the noise is not on 1 kHz multiples, so it’s easier to tell them apart from the distortion products being looked for.
Here are three examples to illustrate. An unnamed soundcard at 96 kHz:

At 88.2 kHz:

At 44.1 kHz:

As you can see, the choice of sample rate can easily affect the ability to read the distortion plots. Make a choice on sample rate at this point and use it for tests 4 through 6.
4. Harmonic distortion
At the chosen sample rate, set the signal generator for a 1 kHz sine wave at 100% output. Run an FFT as above. (A Blackman window seems to work better for this test.) As mentioned above, re-run the test for levels at:
- 0 dBV (100%)
- -1 dBV (89%)
- -20 dBV (10%)
Not all of these plots will be interesting, but it’s worth just going through each of them and capturing the results for later analysis. If a single number (THD) is needed, the software you are using will need to be able to detect and calculate the harmonics. Otherwise, “distortion products below -X dB” is a good way to characterize the result.
5. CCIF intermodulation distortion
Set the signal generator for two signals: 19 kHz @ 50% and 20 kHz @ 50%, and run the FFT. The three level variants should be run as before:
- 0 dBV (50%)
- -1 dBV (45%)
- -20 dBV (5%)
The even-order distortion components are at 1, 2 kHz, etc, and the odd-order components at 18 and 21 kHz, 17 and 22 and so on. I’ve read somewhere that is is sufficient to simply quote the level of the 1 kHz and the 18 kHz components to provide a summary figure.
6. SMPTE intermodulation distortion
Set the signal generator for two signals: 60 Hz @ 80% and 7 kHz @ 20%.
Set the frequency range to display in the FFT modules to 11-12 kHz. If necessary, adjust the FFT parameters for a 4-8 second FFT length. As before, the three level variants should be run:
- 0 dBV (80 and 20%)
- -1 dBV ((72 and 18%)
- -20 dBV (8 and 2%)
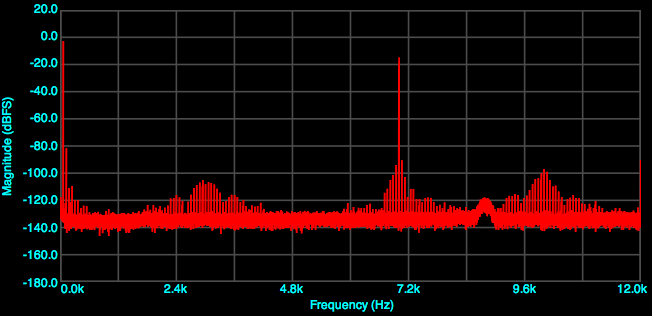
The components to examine are the 60 Hz sidebands of the 7 kHz component. I’ve seen some tests posted on the web where the harmonic distortion components (120, 180 Hz etc) of the 60 Hz wave are measured. I’m fairly sure this is incorrect – for intermodulation distortion, you are looking at the sum and difference frequencies. For example:

In this figure, the 7 kHz tone is visible at about -14 dB. To the sides of it at 60 Hz intervals are the distortion products created by the high-level 60 Hz signal modulating the 7 kHz waveform. (Hence: inter-modulation distortion.) Those are the ones we care about. In this example, the two nearest distortion components are more than 90 dB below full scale. However, since the 7 khz component is at -14 dB, I think it would probably be more accurate to quote the level of the distortion components here as around -75 dB and below.
7. Microphone input
The microphone input should be tested with gain, since that’s how it will be used for speaker measurement. While I haven’t actually seen an interface misbehave yet in the mic preamp, it seems like a good test to do to make sure. To do this, we need to generate a low-level signal that is roughly what we might expect from a microphone. This is harder than it sounds. If all interfaces had exemplary behaviour, it would be easy…
The general idea is to make two plots, one with a low signal level and low gain, and one with the same signal and with high gain. The difference between “low gain” and “high gain” is (I have decided) 40 dB. The “low” level is chosen so that it’s towards the bottom of the mic gain range, and then with most interfaces, the “high gain” setting should be near the top. If I had to pick figures that will usually work, I’d say -46 dBV and -6 dBV are a reasonable bet.
The simple way to do this in a well-behaved interface is to use the digital signal generator to set the signal output to a low level, and run an FFT. Then increase mic input gain by 40 dB and run it again. However, if the interface is a bit noisy on its output, this just doesn’t work that well. In that case, an external attenuator is needed. I’m currently using a Behringer DI-100 “direct injection” box, which costs about $40. It has two 20 dB pads on its input, making gain changes relatively simple. It has some issues, one being that it is (of course) poorly designed or at least specified and has an insertion loss of 6 dB. Also, it does introduce some noise and distortion itself, but with both pads engaged (i.e. 40 dB attenuation) the distortion is quite low. A better solution would be to use something like this circuit using a Jensen transformer.
That’s it in a nutshell. If the interface is well behaved, this procedure will work:
- Connect a loopback cable from a line output to a mic input.
- Set the digital signal generator to 1 kHz and -6 dB (50%) output.
- Adjust the microphone input gain to read 0 dB FS.
- Externally reduce the signal level by a further 40 dB. Run a distortion plot.
- Increase the mic input gain by 40 dB so that the signal again reads 0 dB FS, and reduce the digital signal generator to -7 dB (45%) of full output. Run a distortion plot.
If using a Behringer DI-100, this procedure will work:
- Insert the DI-100 in the loop, with no pads engaged.
- Set the digital signal generator to 1 kHz and full (100%) output.
- Adjust the microphone input gain to read 0 dB FS.
- Engaged both pads on the DI-100. Run a distortion plot.
- Increase the mic input gain by 40 dB so that the signal again reads 0 dB FS, and reduce the digital signal generator to -1 dB (90%) of full output. Run a distortion plot.
If the two distortion spectra are substantially different, then there may be an issue.
More tests wanted
I’m still trying to come up with additional tests that can be conducted with inexpensive equipment and which yield useful results. In some cases, I’ve done the tests on a unit, but they haven’t so far shown anything that wasn’t already apparent from other tests (above).
If you have ideas on these or other useful tests, please post a comment below.
Transient response
I’ve been trying to come up with a test that can be used to show differences in power supply behaviour. My first thought was that a tone burst test of some kind might work. However I don’t have a program to measure or capture tone bursts.
The next thought was that a low-frequency square wave might work for stressing the power supply. If a higher-frequency sine wave were also played, then perhaps the distortion spectrum could be used to show up problems. However, on the device I tried it on, the test didn’t tell me anything that I didn’t already see from the SMPTE test.
Jitter
I tried running a “J-test” but ran into a couple of problems. First the device that I was trying to test can only be run as a 24-bit device, and generating a square wave at 1 LSB is not possible with the software that I have. I tried various levels of the square wave anyway, including one that is close to LSB at 16 bits, but couldn’t generate anything that looked like jitter. So either the device I was testing is essentially immune to jitter, or the equipment I have is inadequate for testing jitter. I’ll try a couple of other units.
Concluding remarks
Here are some examples of applying this protocol:
- A sample soundcard measurement – Edirol UA-25EX
- Microbook II measurements – I
- Focusrite Scarlett 2i2 measurements
Once again, comments would be appreciated in the box below.