JoTT – IMD and HD testing
A few years ago I started on trying to make measurements of audio interfaces with an aim to use them to test other audio equipment. For example, here are measurements of the Focusrite Scarlett 2i2 and the MOTU Microbook II. I never got that far with it.
With the recent acquisition of the remarkable RME ADI-2 Pro, it’s time to revisit. This time, I’m looking for a simpler way to characterise performance. The early effort involved too many screenshots that were a pain to put into HifiZine articles. Plus, there wasn’t any way to say much about correlation to audible performance.
Introducing JoTT
The test signal I’m using now I call JoTT – short for John’s Torture Test (I had to call it something). I started by combining the CCIF and SMPTE test signals for IMD, and then modified it to make it most useful (for me). It has the following sine wave components:
| Name | Frequency | Level in dB FS | Level in percentage |
| A | 110 Hz | −8 dB | 40% |
| B | 3 kHz | −20 dB | 10% |
| C | 9 kHz | −14 dB | 20% |
| D | 10 kHz | −14 dB | 20% |
The peak signal level is -1 dB FS. This avoids odd results that some DACs exhibit at 0 dB output. (If 0 dB FS is actually required in the test signal, increase A to −6 dB FS or 50%.)
To generate JoTT (and plot the results), I am using the Electroacoustics Toolbox. Here is the spectrum of the generated digital signal (at 96 kHz sample rate):

Use as a test signal
For the sake of an example, I’ll use my Vioelectric HPAV200 with 24/96 coax DAC module (the older one). I’m driving it at the SPDIF input because the measurements of the amplifier alone are better than of the DAC. (For the purposes of explaining the test signal, it’s actually more helpful to use the worst-measuring input.) The output is taken from the left channel of the headphone jack.
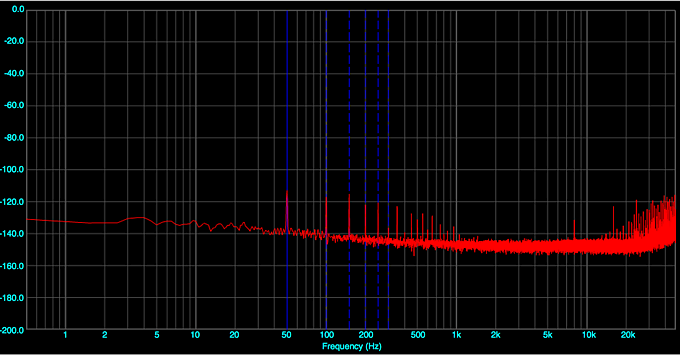
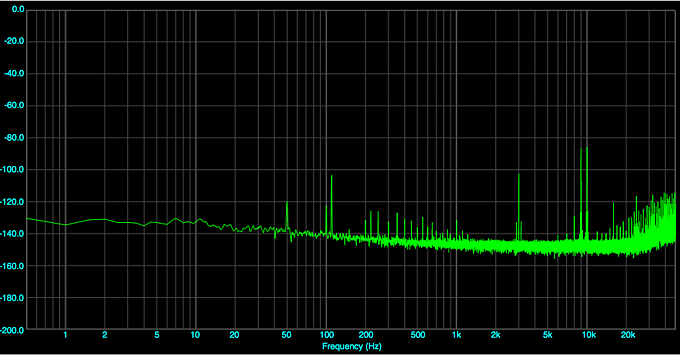
I set signal levels so that 0 dB in the graphs is 1V RMS. First, here is the noise floor. There’s a very low amount of mains noise at 50 Hz and multiples of it. Also, there is some high frequency noise – I don’t think this is in the V200 itself, but is coming through ground somehow as I’ve just noticed that it appears in other measurements where I used a single-ended connection.
Here is component A (110 Hz) turned on. The cursors identify its harmonics:
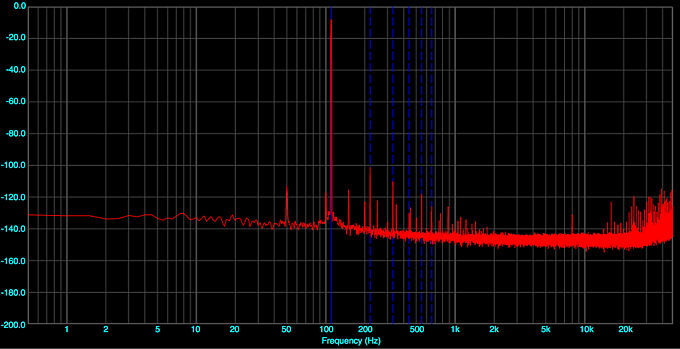
Note: the levels of the harmonics is almost identical if I play just a 1 kHz sine wave at -8 dB. (If I play the 1 kHz sine wave at -1 dB instead, the levels and distribution of harmonics changes. However, you can’t have everything.)
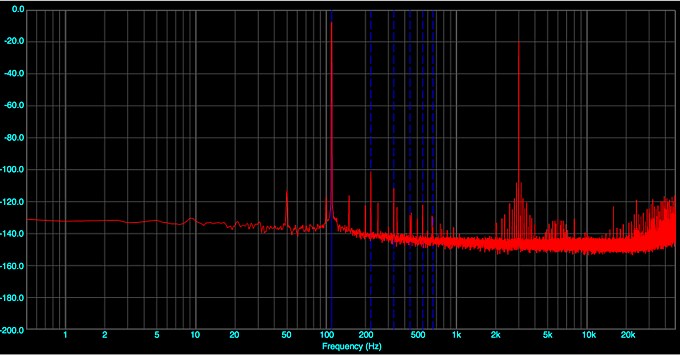
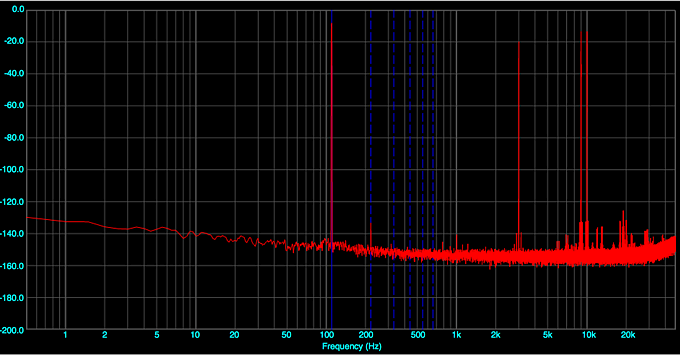
If I now turn on component B (3 kHz), there is a small “forest” of intermodulation products around it. There is also a little thicket at 6 kHz, its second harmonic:
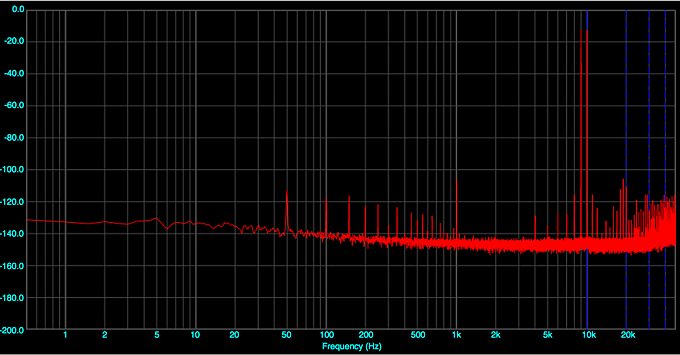
Now I’ll turn off A and B and turn on components C and D (9 and 10 kHz). You can see the intermodulation products at 1, 8 and 11 kHz in particular:
Now I turn on B, and you can see additional intermodulation products at 6, 7, 12 and 13 khz.

Finally, I turn on A again, and you see the “grass” of intermodulation products from around 1 kHz and above. This is the all-in-one graph, which I can use to point to both THD and to IMD in a way that clearly shows when a unit has issues – the worse the IMD, the taller and thicker the “grass” becomes.

Summary. From the single graph just above, we can read:
- The levels of the harmonic distortion components (multiples of 110 Hz).
- The level of 110 Hz sidebands around 3 kHz, and also 9 and 10 kHz.
- The level of the main IMD difference sidebands at 1, 7, 8, 12, 13 kHz.
- The thickness and height of the “grass” i.e. higher-order IMD components.
- Noise level from the mains supply.
Don’t get me wrong – this is good performance! If it “looks bad” that’s because the test is intended to show up problems. Hence the name “torture test.” I have others much worse, which I will may post at a later time…
JoTT is also useful for a quick crosstalk check, because of the multiple tones spread across the spectrum. I connected the right channel from the headphone amplifier and plotted its spectrum, while the signal generator was running into the left channel. You can see that there is some crosstalk, but it’s fairly low:
Reference loopback
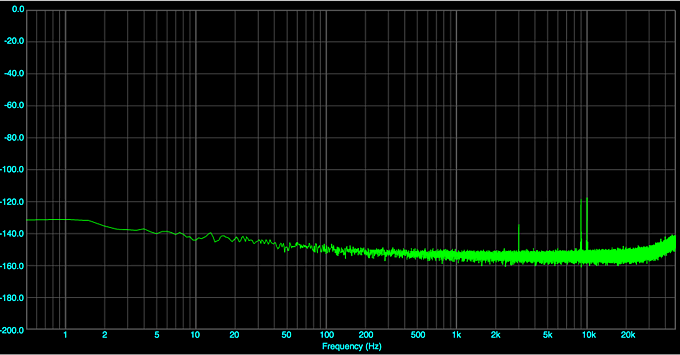
Wait! How do I know that I’m not measuring the performance of my audio interface (the RME ADI-2 Pro, in this case)? Well, here is the graph when the analog output of the ADI-2 Pro is connected to its input:
Note: the DAC in the ADI-2 Pro is not being run at -1 dB FS. If I did that, there would be more distortion (although still very low). So this is not an “apples to apples” comparison of the ADI-2 Pro’s DAC with the Vioelectric DAC. Because that’s not what I’m trying to do here. The point is that the ADC of the ADI-2 Pro is being fed the same level of signal, and as shown in the above graph, the amount of distortion it introduces is insignificant (no more than shown, as the plot includes DAC and ADC distortion).
And here is the crosstalk for the ADI-2 Pro loopback:
Summary
What can I say, the ADI-2 Pro is incredible. I can now measure stuff I never could before. I will post some examples of JoTT measurements of other DACs soon, and hopefully the JoTT will appear in future HifiZine articles. If you have any suggestions or comments, please fill in the box below.